Track cost and security trends over time
Every cloudrift scan is a snapshot. Run it weekly and you get a series of snapshots — but comparing them by eye across terminal output, PDFs, or CSVs doesn’t scale. history --html turns your local scan history into one report that answers the question people actually ask: is this getting better or worse?
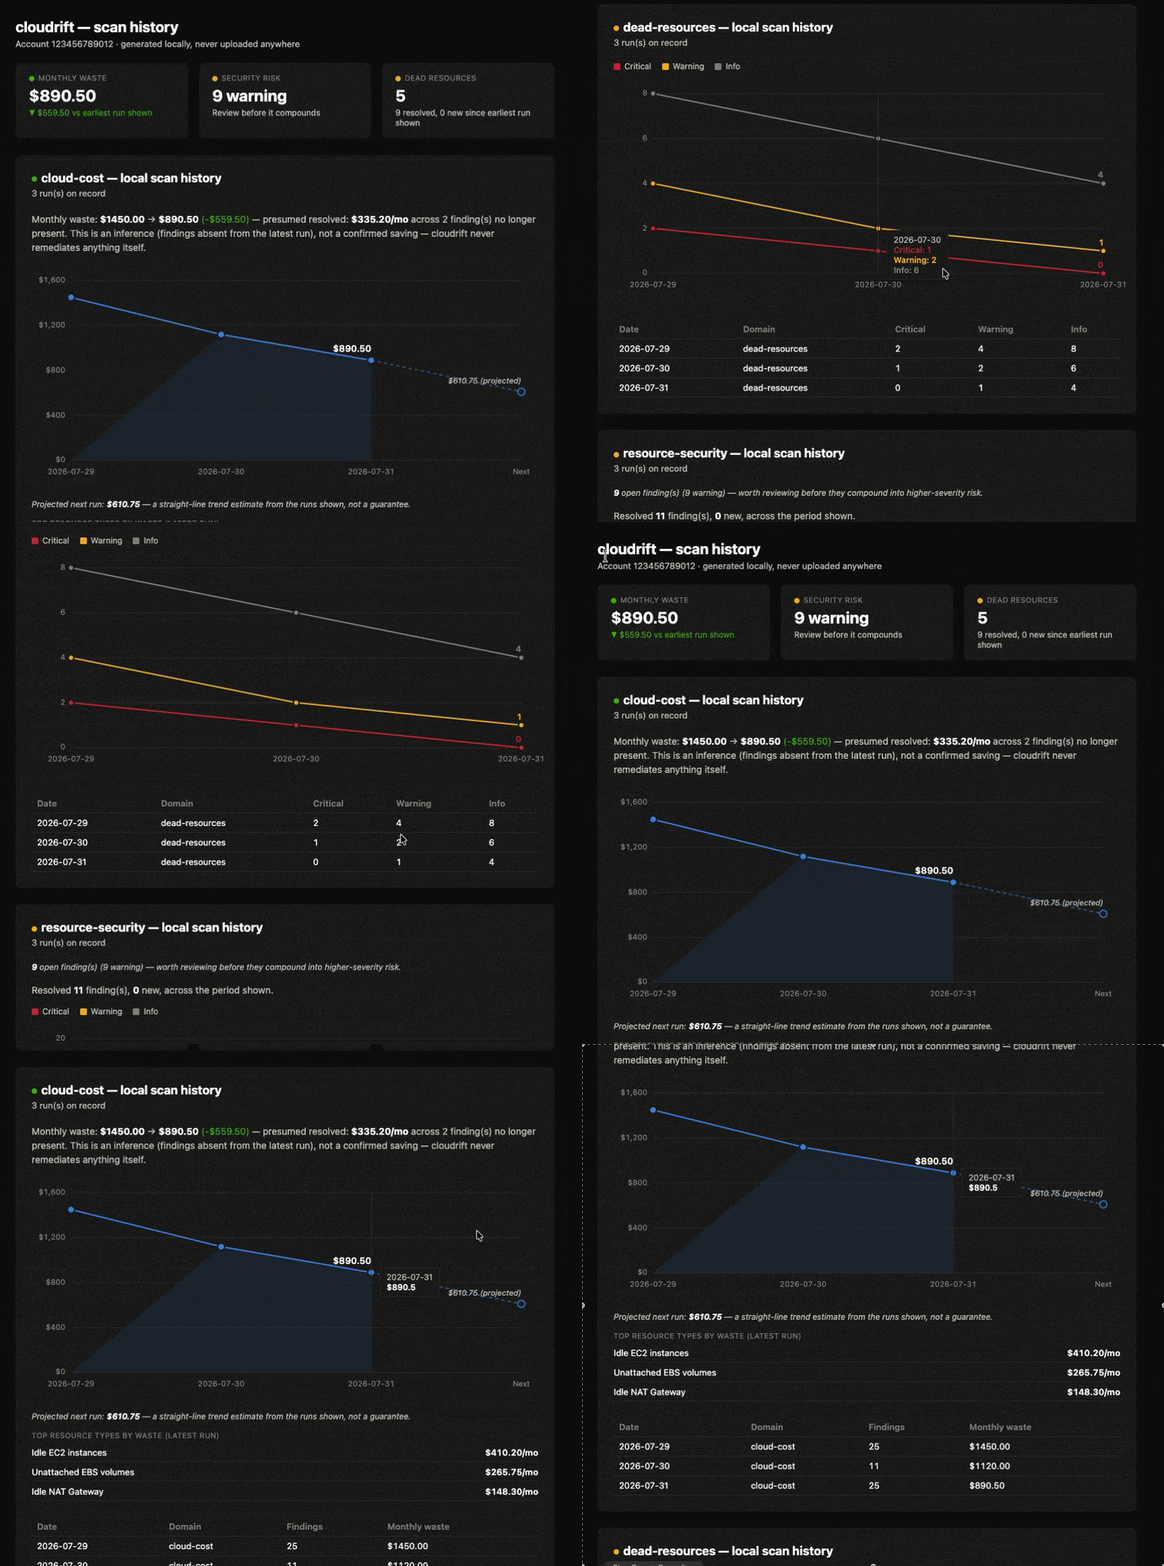
cloudrift history --htmlGenerates a single, self-contained HTML file — no server, no dashboard to host, no BI tool to configure, no chart library shipped. Just open it in any browser. Everything in it comes from scans that already ran on your machine; nothing is uploaded anywhere to build it.
What’s in the combined report
Executive summary
Three stat tiles up top: Monthly Waste, Security Risk, and Dead Resources. Each carries its own health indicator (a green/yellow/red dot), not one global status for the whole account. A bad week in security shouldn’t visually bury the fact that cost is under control, and vice versa — each domain earns its own verdict.
Cost trend and forecast
A line chart of monthly waste across your scan history, extended with a dashed projection one step past the last real run. It’s a straight-line extrapolation of your actual trend, labeled “projected” and never presented as a guarantee.
Top wasters
The specific resource types burning the most money right now, ranked, pulled straight from the latest scan’s cost breakdown.
Security and hygiene trends
resource-security and dead-resources each get a three-line chart (critical / warning / info) instead of one aggregate number, so you can see whether the shape of your risk is improving, not just a headline count.
Plain-language risk narrative
A qualitative read of where you stand on security, deliberately without an invented dollar figure. There’s no honest way to price a security finding the way AWS list prices exist for wasted compute, so the report doesn’t pretend otherwise.
Usage
# Combined report (all three domains)
cloudrift history --html

# Single domain only
cloudrift history --domain cloud-cost --html
cloudrift history --domain resource-security --html
cloudrift history --domain dead-resources --html

# Compare two specific snapshots
cloudrift history --compare
Run it for a single domain to get just that one chart, or without --domain for the full combined report shown above. Same rule as the rest of cloudrift: read-only, generated locally, nothing leaves your machine.